Maps have become essential in today’s business, used in everything from food delivery and marketing analytics to retail applications and autonomous driving. Beyond establishing data standards, the NDS Association and its members develop tools for mapping and data analytics that support location-based services and map developers.
NDS continuously works to improve map quality, focusing on how it can be achieved and measured efficiently. Map data statistical analysis plays a key role in this process. By collecting, processing, and quantifying map data, statistics allow developers to assess the completeness, accuracy, and consistency of maps. Statistics provide actionable insights into attribute coverage, data gaps, and changes between map versions, supporting continuous improvement. High-quality statistics enables better decision-making in map production, validation, and comparison across map data providers, ultimately ensuring that maps are reliable, comprehensive, and fit for modern applications such as autonomous driving and advanced navigation systems.

One of the most effective ways to evaluate map quality is through statistical analysis. Map developers need detailed statistics to evaluate the accuracy and usability of mapping data. For instance, knowing how many restaurants on Google Maps have opening hours listed helps identify gaps in Points of Interest (PoI) coverage and ensures end-users have reliable information. Also, analyzing how many kilometers of roads have speed limits assigned allows developers to assess critical navigation attributes that directly impact routing, safety, and compliance with local regulations.
Tracking changes in these metrics across map updates is also important. It helps developers monitor data growth, detect inconsistencies, and ensure that new information is correctly integrated without losing or corrupting existing data. Statistical analysis allows mapmakers to make informed decisions, prioritize updates, validate map quality, and compare their maps with competing datasets or different providers. In this way, statistics transform raw map data into actionable intelligence that results in high-quality maps, improved navigation services, and more reliable location-based applications.
Collecting and analyzing map statistics is challenging due to the variety of formats, data models, and the large volumes of data that must be processed. In particular, gathering statistics for NDS maps presents additional complexity, as the data is highly detailed, with nested structures and feature attributes often scattered across multiple layers, making it difficult to organize for straightforward analysis. Developers must consolidate this dispersed information to generate meaningful insights, which can require substantial resources. The extensive number of calculations needed for large-scale datasets further intensifies the challenge. Visualization of statistical data adds another layer of difficulty, as it must convey complex information in an understandable and actionable way. Key challenges with map data statistics include:
NDS map statistic is a crucial initiative for NDS members as it provides the foundation for measuring and improving map quality. Drawing on extensive experience in mapping and recognizing the ongoing need for statistical analysis at different stages of map creation process, one of our active contributing members, Intellias, has led the development of a generic framework for map statistic gathering. The company participates in diverse initiatives, including the establishment of IntelliMapLab at a local university and hosting students at the Intellias offices in Poland and India, where young talents gain hands-on experience working with maps and location data. During these practical sessions, Polish students contributed to map data statistics analysis, applying and refining their skills directly within the Intellias working environment.
The Map Statistic Framework is a flexible and modular solution designed to support multiple map formats, handle complex data models, and deliver powerful visualizations. NDS.Live was the initial format for which the framework was adapted.
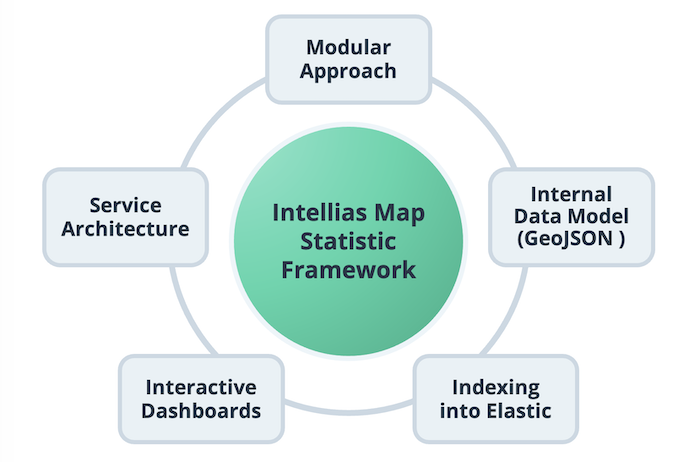
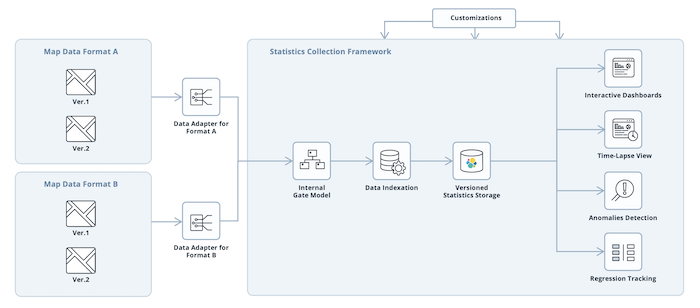
The Map Statistic Framework is designed to collect and process data in various formats. Its modular, service-oriented architecture supports NDS Classic, NDS.Live, OSM, and Overture Maps formats, providing data adapters that convert diverse datasets into a unified model suitable for statistical calculations. The framework enables developers and researchers to analyze map data consistently across formats, ensuring high-quality, interoperable map products.
Key features of the Map Statistic Framework include:
Through this framework, Intellias strengthens the NDS community by providing a robust tool for evaluating map quality, supporting research and development, and advancing standards for map data statistics.
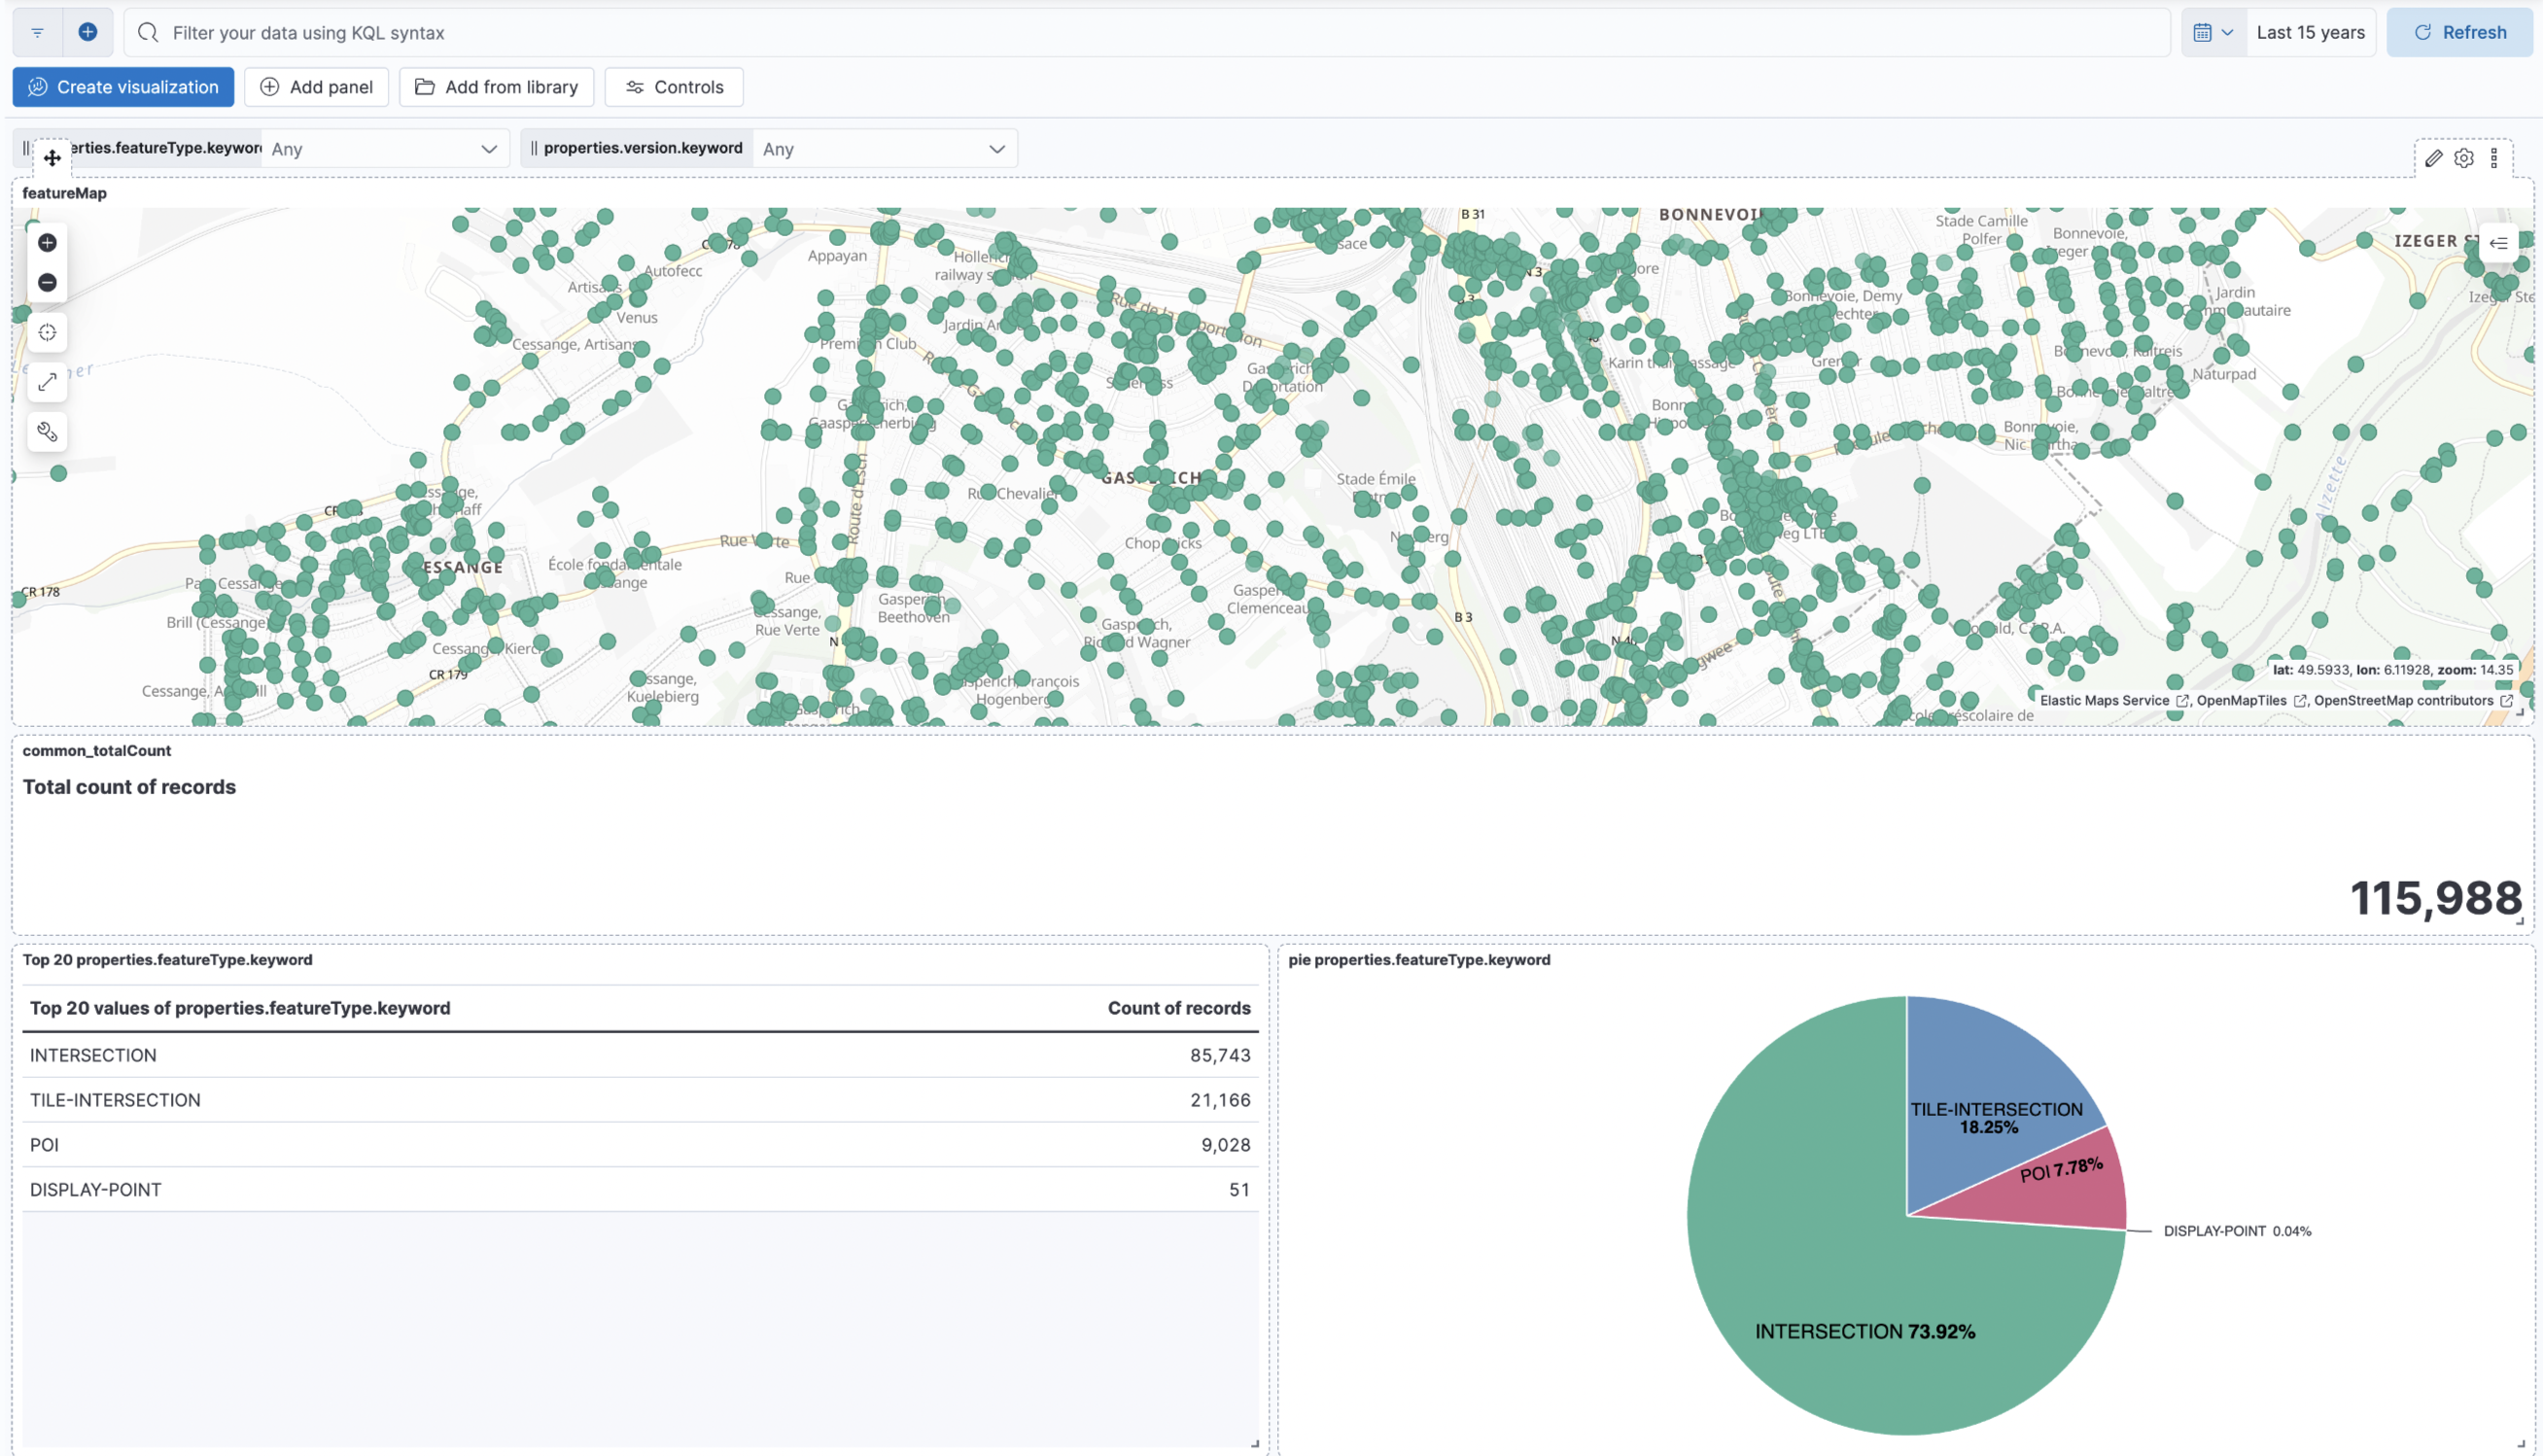
Intellias developed the Map Statistic Framework to provide a versatile tool that NDS members can use, customize, and adapt for their own mapping needs. This important contribution empowers other members, strengthens the NDS ecosystem, and adds a valuable resource for improving map quality and analysis. The framework leverages an open-source, Elastic-based architecture, with dashboards that allow users to monitor map versions and track changes over time.

Statistics generated by the framework offer several benefits for map developers and consumers, such as logistic companies or OEMs. They enable comparison of map quality and data coverage, help address the challenges of sourcing and curating high-quality map data from multiple sources, and enhance interoperability between different map datasets. By providing actionable insights, the framework supports better decision-making and more reliable map development.

Developers: The Map Statistic Framework enables map developers to build advanced map services and geospatial applications with confidence. By providing detailed statistical insights, developers can optimize routing algorithms, enhance navigation features, validate attributes coverage, and ensure consistency across different map versions and data providers. This allows them to create more reliable and accurate location-based services for end users.
Researchers: For researchers, the framework offers a powerful tool to analyze geospatial information for a wide range of studies, including urban planning, transportation modeling, environmental monitoring, and climate impact assessments. Access to detailed map statistics helps identify trends, assess infrastructure coverage, and support evidence-based policy-making and scientific investigations.
Organizations: Organizations can leverage comprehensive and up-to-date map statistics to improve operational planning, resource allocation, and strategic decision-making. From logistics and fleet management to public services and emergency response, actionable map insights allow organizations to optimize efficiency, reduce costs, and make data-driven decisions.
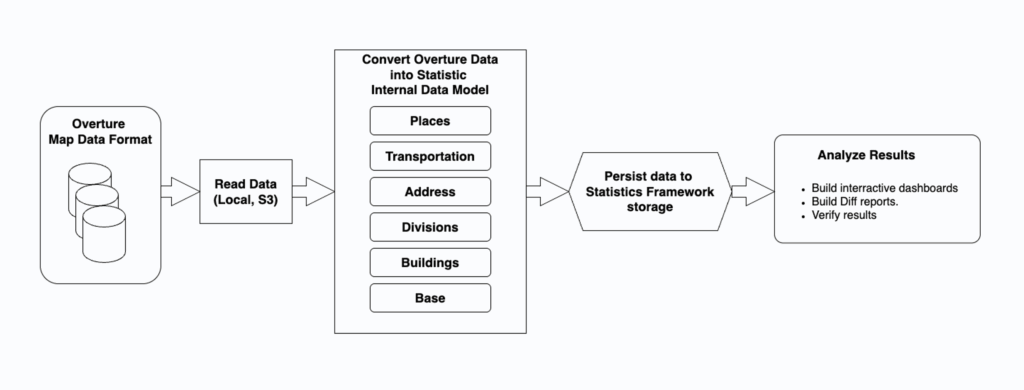
Overture Map Statistics Generation: Looking ahead, the framework will support the generation of standardized Overture Map Statistics, enabling the community to monitor data quality, interoperability, and completeness across open map datasets. This initiative will provide a foundation for future tools and visualizations, empowering all stakeholders working with geospatial data to gain deeper insights and drive innovation in mapping and location-based services.
Statistics highlight differences between map versions, and with the support of another key NDS tool, for example MapViewer, these differences can be visualized directly on the map. MapViewer allows users to visualize map features and attributes and highlight the changes between map versions. The Map Statistic Framework provides the underlying data calculations, enabling MapViewer to present statistics in a clear visual format.
Statistical analysis is essential for ensuring high-quality maps and supporting the development of reliable, accurate, and comprehensive map data. Tools like the Map Statistic Framework exemplify how NDS members contribute to community projects that advance mapping standards and drive future mobility forward.
For the latest information on NDS tools, frameworks, and community initiatives, visit the NDS Developer Portal to stay updated on new projects and resources.
Back to news →